Publishing and Promotion in Economics
Anecdotal evidence suggests that career advancement in economics is strongly influenced by publishing in the Top 5 economics journals. Despite wide acknowledgement of the T5’s influence among academics themselves, actual evidence on such influence is sparse, and the discussion about the incentives generated through this practice are lacking. The Tyranny of the Top 5 project fills this gap in the literature by documenting the existing incentive structure in academic economics, and by discussing how excessive reliance on T5 publications to filter quality can interact with existing editorial practices (particularly in the T5 house journals) to perversely influence both the direction and quality of scholarship.
We explore these deficiencies in the literature through four lines of inquiry, each addressing a different facet of the problem:
- First, we document the degree to which publications in the T5 influence tenure decisions relative to publications in comparably high quality non-T5 journals. Analysis of longitudinal work-history data for tenure-track faculty hired by the Top 35 departments reveals that T5 publications significantly increase the probability of receiving tenure and decrease time-to-tenure. The influence of non-T5 journals pales in comparison. (See Figure 1)
- Second, we corroborate our empirical findings with results from a survey of tenure-track faculty hired by the T50 departments. We find that junior faculty are acutely aware fo the power of the T5. They (correctly) believe that T5 publications are the most important determinant of career advancement (see Figure 2), and that publication in the T5 has a quality-independent effect on tenure and promotion decisions (see Figure 3).
- Third, we use data on citations to evaluate the adequacy of the T5 as a filter of quality. We find considerable intra-journal heterogeneity and inter-journal overlap in citation distributions of T5 and non-T5 journals, indicating that the mere placement of an article in the T5 does not sufficiently predict the quality of an article, and that the field of economics ought to seriously question its use as a screening device.
- Lastly, we investigate editorial practices in the T5 journals and find that editorial term lengths are unregulated in the T5 house-journals (see Figure 4), and that these house-journals tend to allocate large shares of their journal space to articles published by individuals affiliated to the journal editors.
The joint existence of the T5’s powerful influence, unregulated editorial terms, and professional incest leads to the concentration of power in the hands of a small group of editors and generates incentives that distort the direction and innovativeness of future research. Our findings should spark a serious conversation in the profession about how to develop implementable alternatives to judge quality research. Such solutions would necessarily need to de-emphasize the role of the T5 in tenure and promotion decisions, and re-distribute the signalling function among more high-quality journals. However, a proper solution to the tyranny of the T5 needs to address the flaw inherent in judging a scholar’s potential for innovative work based on a track record of publications in a handful of journals selected based on aggregate measures of journal impact.
Figures
Figure 1: Predicted Probabilities for Tenure Receipt in the First Spell of Tenure-Track Employment (Logit)
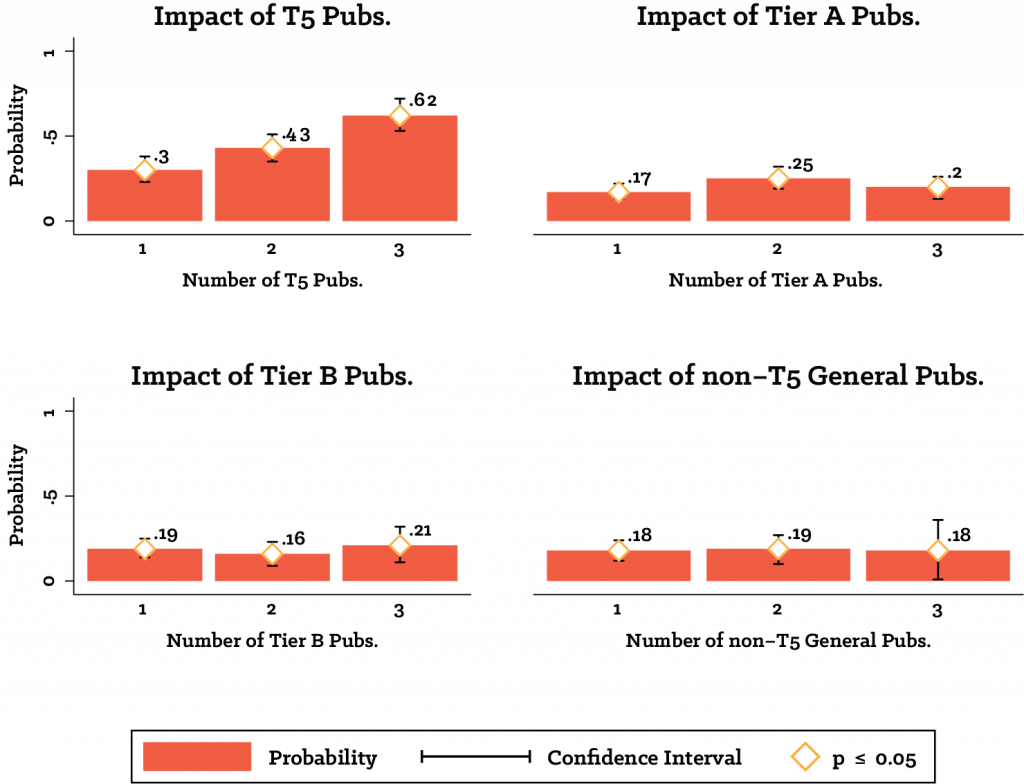
Figure 2: Ranking of Performance Areas Based On Their Perceived Influence On Tenure and Promotion Decisions

Figure 3: Probability That Candidate with T5 Publications Receives Tenure or Promotion Instead of Candidate with non-T5 Publications, ceteris paribus

Figure 4: Density Plot for the Number of Years Served by Editors between 1996-2016